The rule: a component nobody scanned is not a healthy component.
Architecture diagrams go out of date the week they're drawn, and code-health results live in a dozen tools nobody checks together. The Stack view derives the map from the running system and puts every scanner's latest answer on the box it belongs to, so the picture is current and the gaps show.
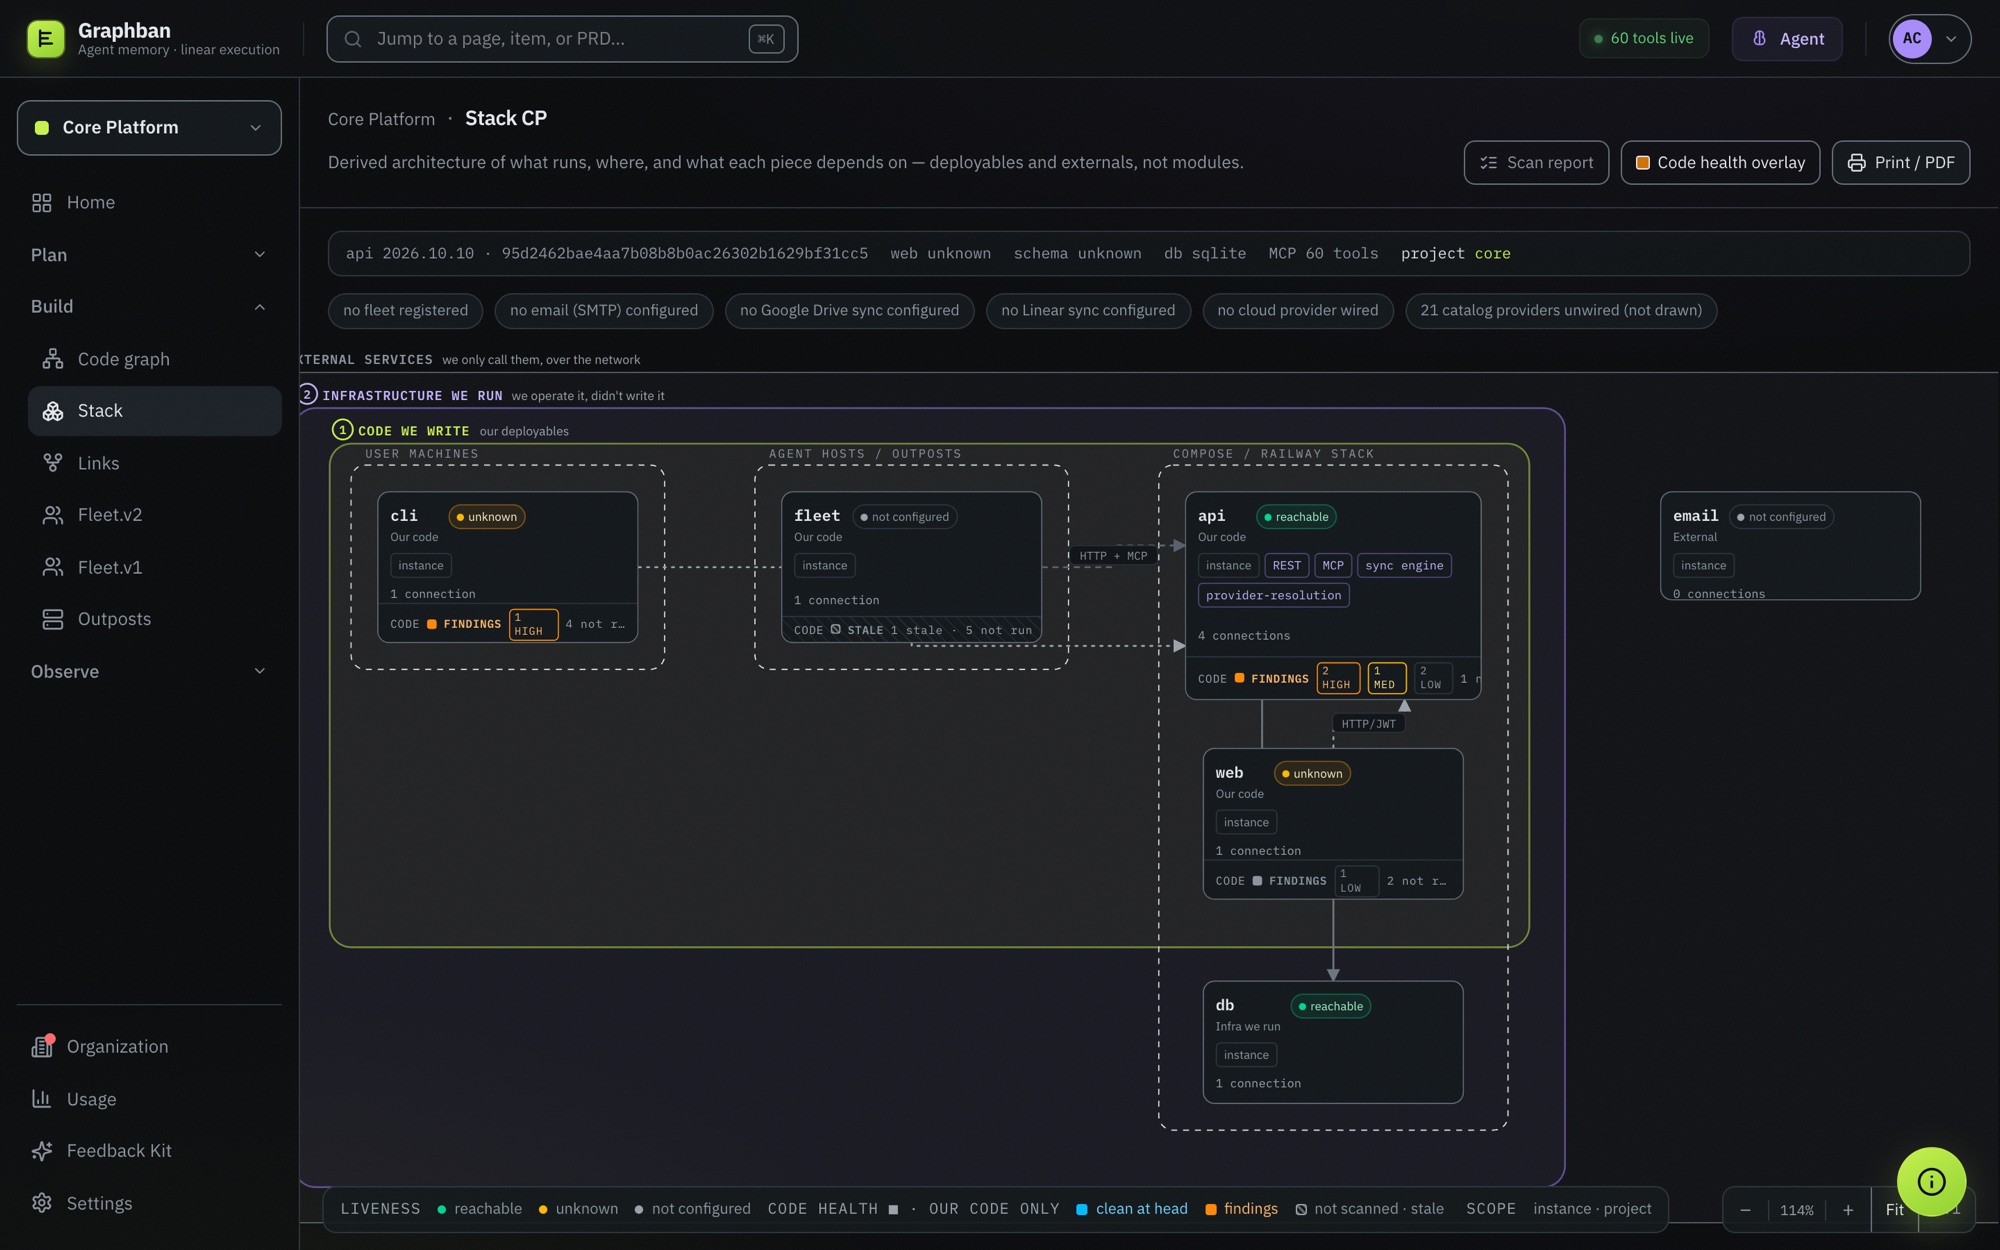
Build → Stack. Every box, frame and edge is computed from what the server reports. The strip on each box is its code health; not scanned and stale are drawn as themselves. Demo instance with sample scan data.
Why it matters
One view answers three people's questions.
For the engineering lead
Where the risk is, by component: security findings, complexity hot spots, unfinished code, and which parts nobody has checked at all.
For the developer
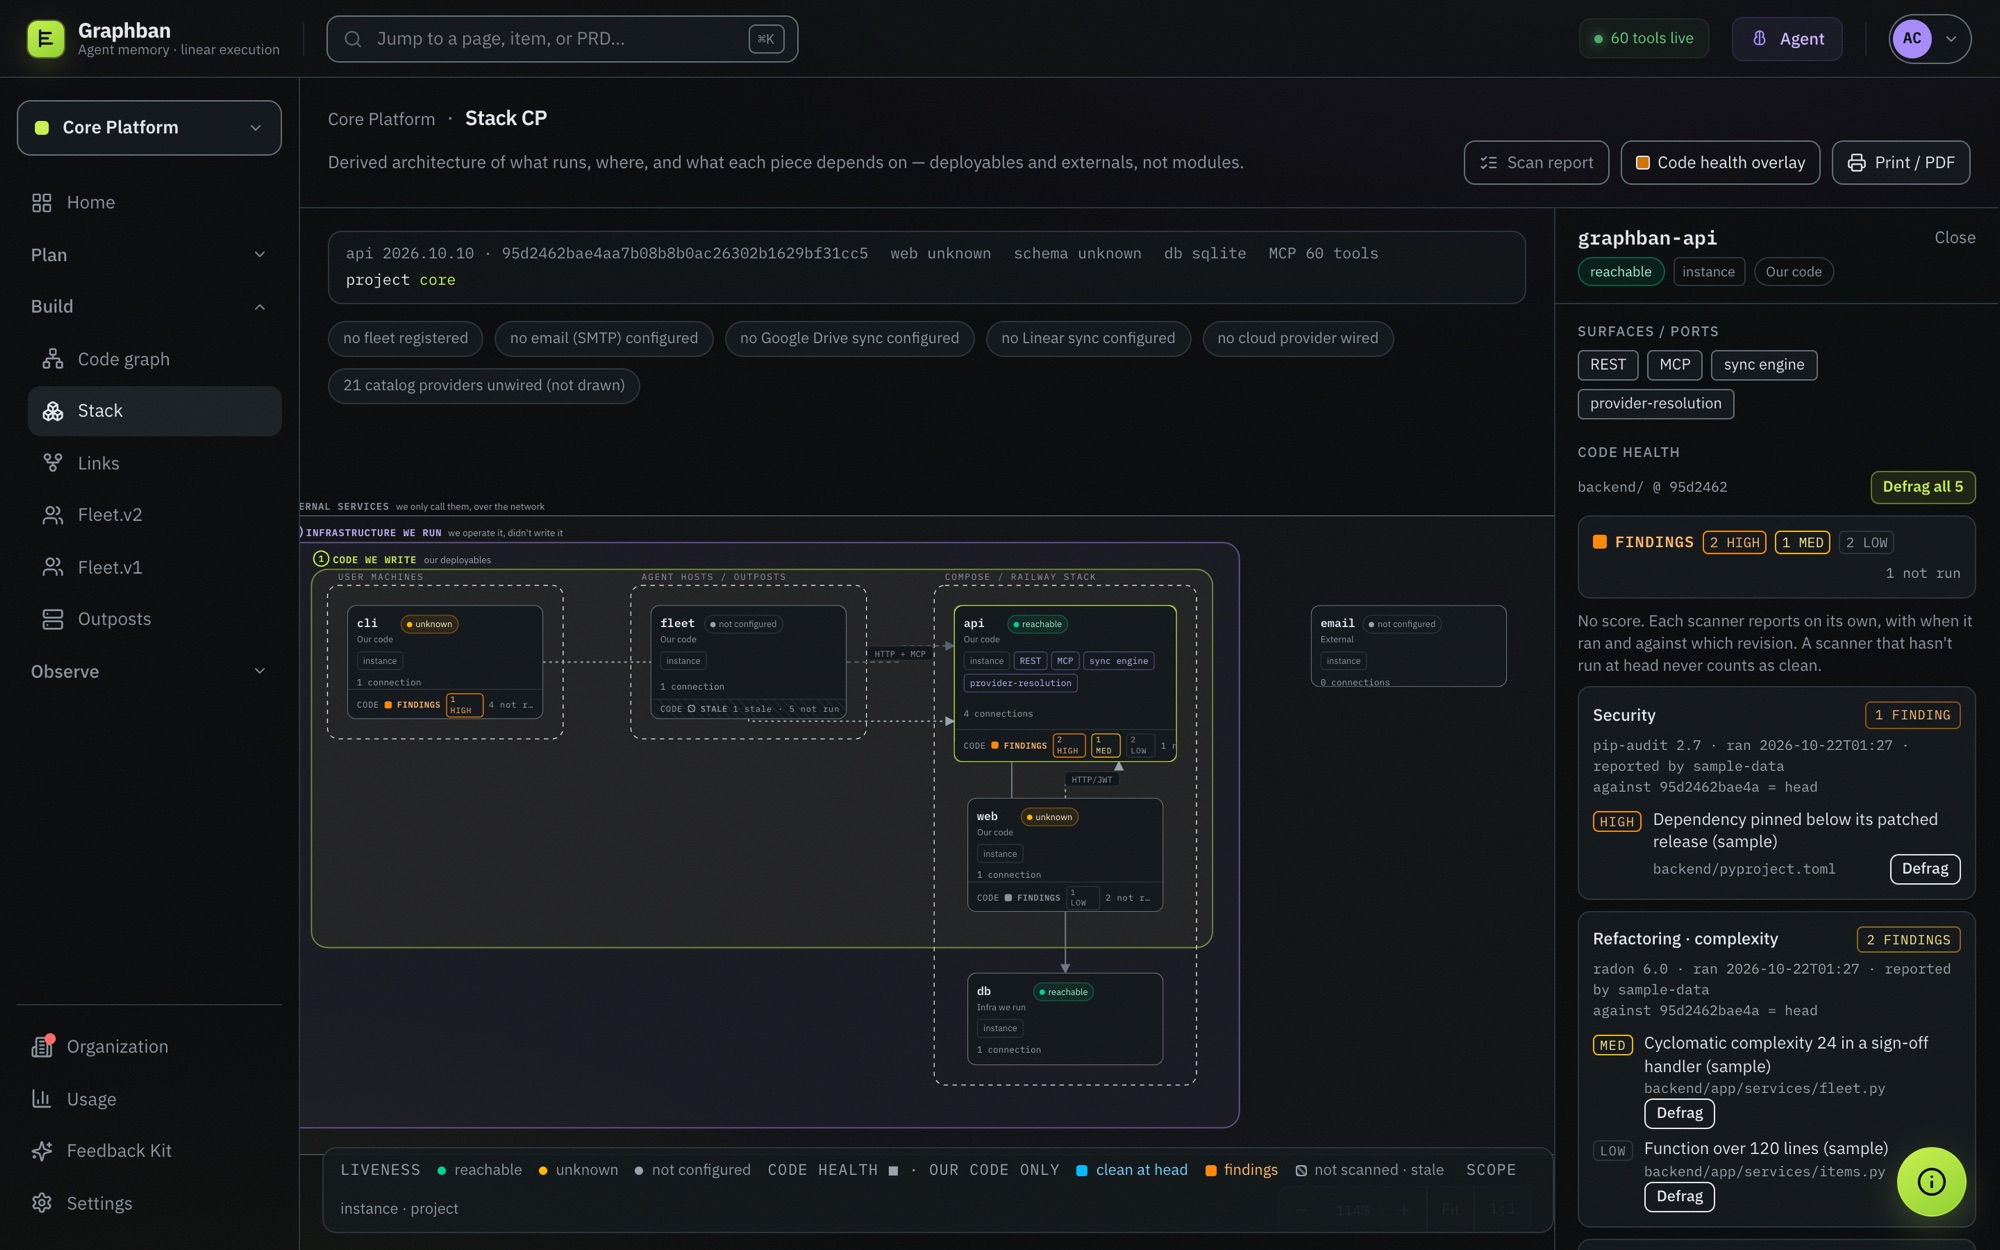
What runs where and what talks to what, before touching it. Click a box for its surfaces, its connections and every finding, with the file.
For the agents
Tech debt stops being a vague backlog. One click turns a finding into a card on the board, where the fleet picks it up and it goes through review like any other work.
The map
An architecture diagram that draws itself.
Nothing is placed by hand. The layout is a function of the topology the API reports, so when the system changes, the picture does too.
① Code we write
Your deployables, grouped by where they run: user machines, agent hosts and outposts, and the compose or hosted stack.
② Infrastructure we run
What you operate but didn't write, such as the database, nested around your code.
③ External services
What you only call over the network, in its own column, so the boundary of ownership is visible.
Liveness on every box. Reachable, unknown or not configured. Never a healthy default.
The facts that drift, in one strip. The running version and commit, the database schema revision, the database engine and the live MCP tool count.
Edges say how. Connections are labelled by protocol, such as HTTP with JWT or HTTP plus MCP.
Hand it to an architecture review. Print or export the whole map to PDF at a readable fit.
What's missing is on the map too
Above the canvas, every absence gets a chip: no fleet registered, no email configured, no Linear sync, and how many catalogued providers are unwired. A diagram that only draws what exists makes a half-configured system look finished.
The health overlay
Every scanner's latest answer, on the component it's about.
Each component carries seven categories. A finding records its severity, file, scanner and version, and the commit it was scanned against.
Hot spots: high cyclomatic complexity, oversized functions
radon, ESLint complexity
Partial implementation
Stubs and placeholders that shipped
a stub scan
Dead code
Functions, exports and files nothing uses any more
vulture, knip, ts-prune
Coverage
How much of the component the code map describes, and whether that description is stale
the code graph, built in
Tests
Whether the suite ran at the running commit, with passed, failed and skipped counts, and each failing test as a finding
pytest, vitest, jest, any JUnit report
Open work
Cards on the board that touch this component
the tracker, built in
Click a box. Its surfaces, then every category: which scanner ran, when, against which commit, and each finding with its file. Demo instance with sample scan data.
No score
A component is never green by default.
There is no health score to game. Each category is in exactly one of four states, and the last two are never drawn as the first.
clean at head
Scanned at the commit that's running, with zero findings.
has findings
Coloured by the worst severity present, so one critical outweighs ten lows.
never scanned
Nothing has looked. Until something does, the state is unknown.
stale
A clean result at an older commit. It doesn't cover what's running now.
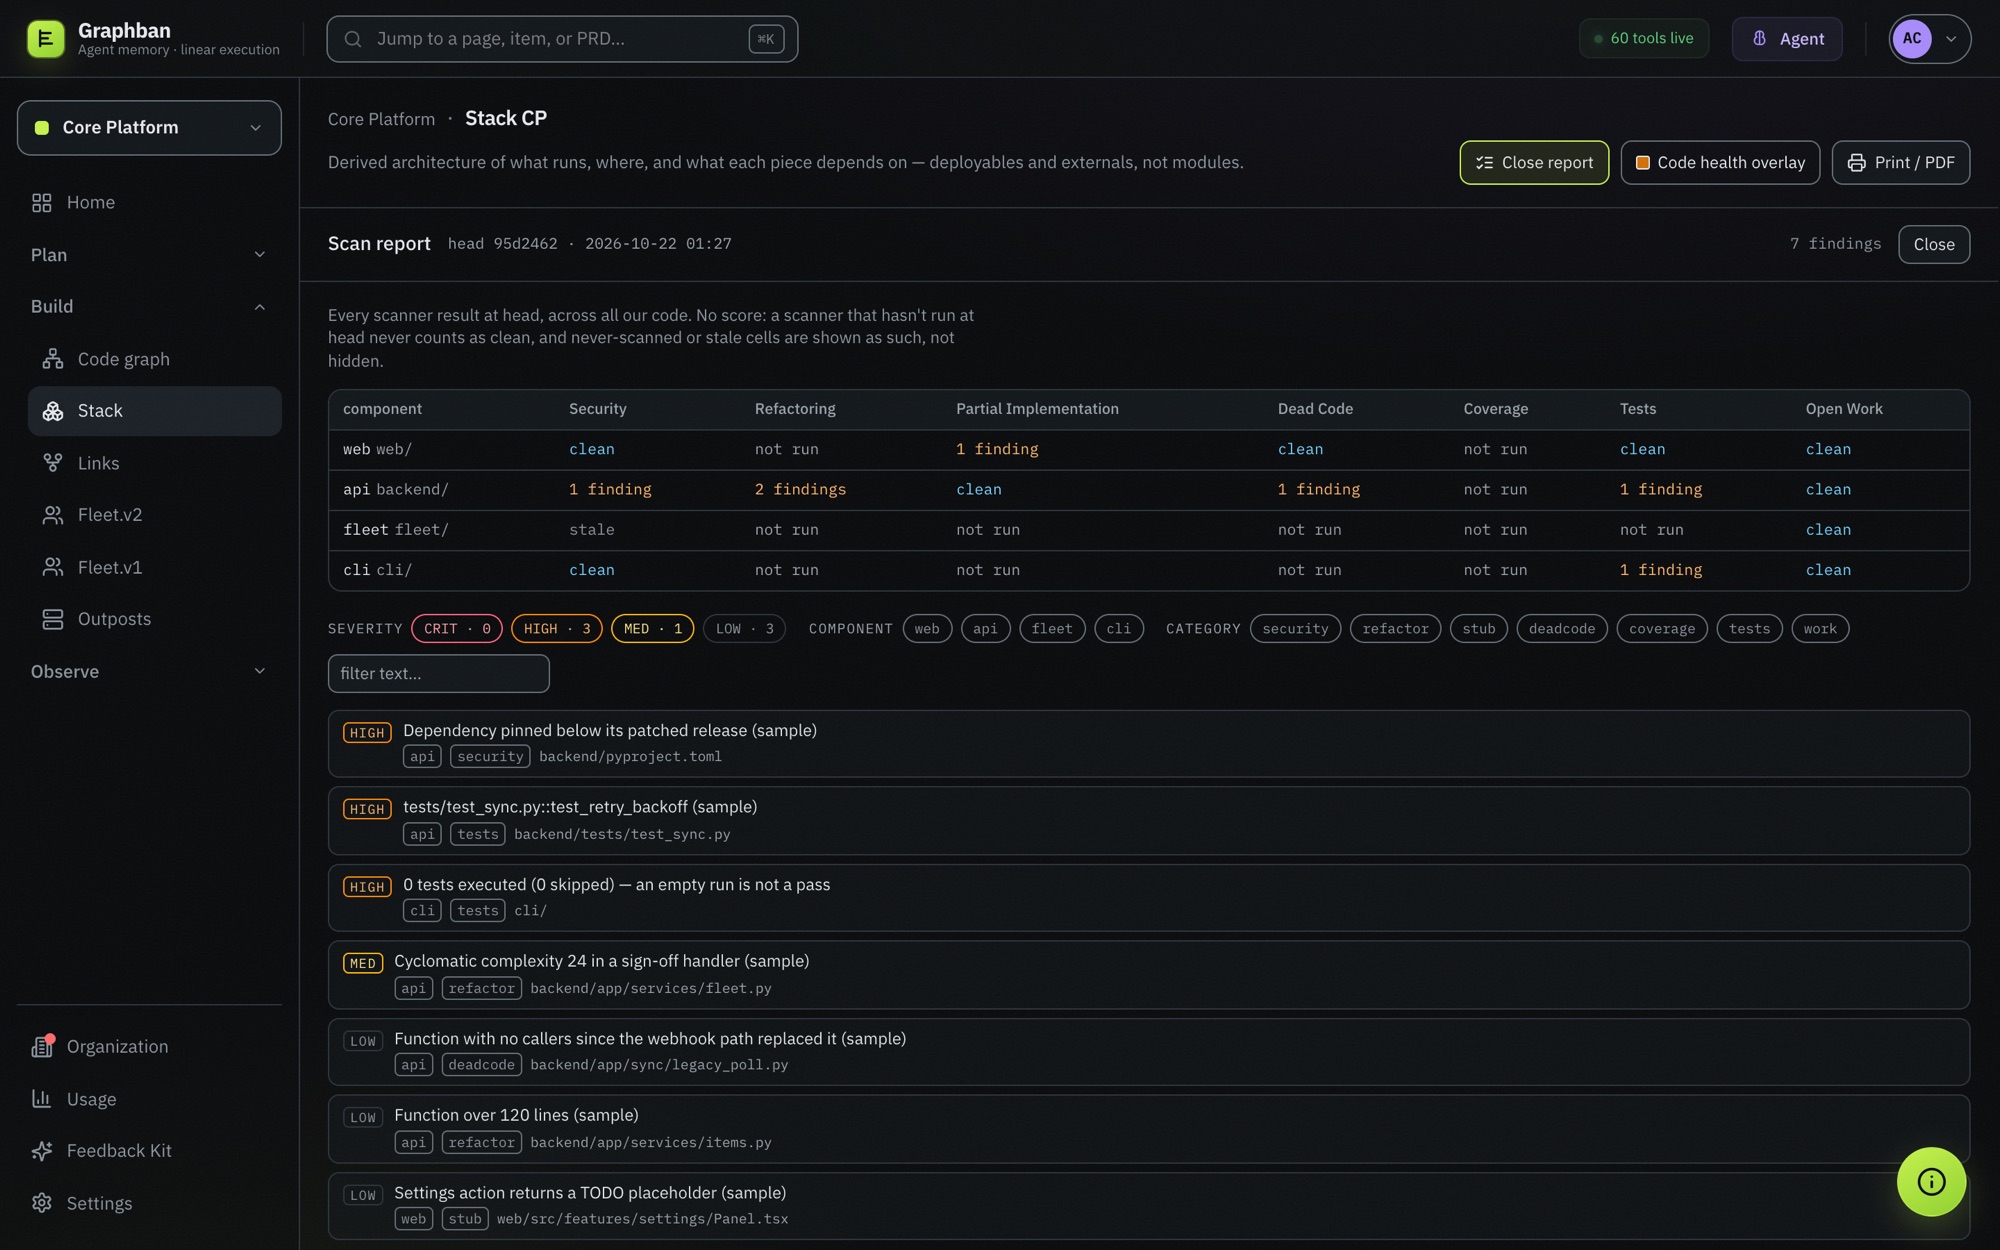
A component only rolls up clean when the result covers its whole tree. One clean file says nothing about the rest. That's why, in the screenshot above, fleet reads stale: its only scan predates the running commit. And cli shows a high finding even though nothing failed, because its test run executed zero tests. An empty run is not a pass, so it is recorded as one. The same limit, for a path in the tree, is the code graph.
The scan report
The whole codebase's health on one screen.
Every component against every category, then every finding, filterable by severity, component, category and text. "Not run" and "stale" are cells, not blanks.
Scan report. Pinned to the running commit, with no score and nothing hidden. Demo instance with sample scan data.
Defrag
From finding to card in one click.
Every finding has a Defrag button that files it as a card on the board, tagged as tech debt. Defrag all files every unfiled finding on a component at once.
Filed once. A finding remembers that it was filed, so the same issue never becomes two cards.
Then it's ordinary work. The card is claimed, built in its own worktree, independently reviewed and verified by CI, like everything else on the pipeline.
And the next scan closes the loop. When the fix lands and the scanner runs again at the new commit, that category goes clean at head. The box follows once every category is.
Where the results come from
Your scanners, your repo. Graphban keeps the answers.
Graphban never runs a scanner. An agent working in your repo runs the tools you already trust and reports the results, the same way it describes code for the graph. CI can post them too, over a key-authenticated REST endpoint.
record_scan(scanner, path, scanned_sha, findings) No commit, no result. A clean scan without a revision can't be told apart from a stale one, so it is refused.
Coverage and open work need no scanner at all: they come from the code graph and the board. How the code graph is built →